23 May

Running a retail business is hard work and finding ways to evaluate how well your business is doing is crucial to make improvements and stay on track for success. In this blog, we’ll discuss some key financial performance metrics you can use to analyze the financial health and performance of your retail operations. Things like sales figures, profit margins, expenses, inventory turns, and more can give you valuable insights into what’s working well and where you may need to make some changes.
Understanding the numbers behind the scenes can shed light on issues you may not notice from the operational side alone. For example, tracking your cost of goods sold and inventory turnover can reveal if you have the right products at the right prices for your customers. And monitoring your expenses against revenue can show if you have any wasteful spending that’s eating into your profits.
So whether you’re just starting out in retail or looking to optimize an existing business, keeping an eye on financial metrics is an important part of the process.
What Are KPIs?
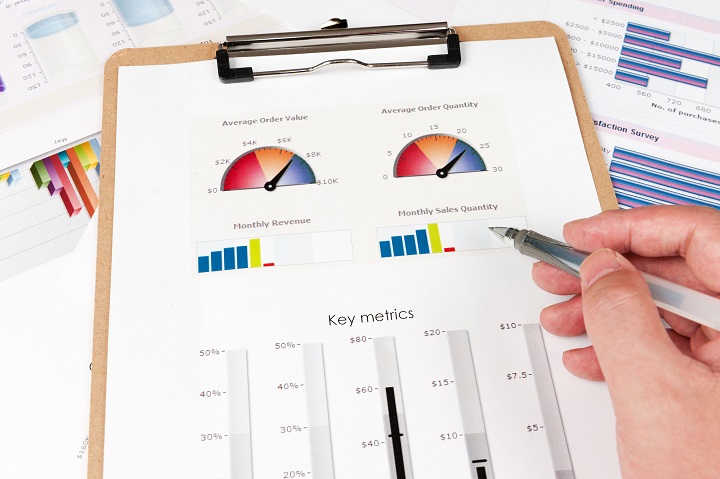
KPIs, or key performance indicators, are metrics that businesses use to track critical aspects of their performance. They focus on financial performance measures that can steer a company toward achieving its aims and goals.

Some common KPIs for retail businesses include:
Sales
Sales per square foot is a vital KPI that measures sales revenue per square foot of store space. For a retail store, this shows how efficiently the space is being used to generate revenue. It’s useful for:
- Benchmarking against competitors
- Identifying underperforming stores
- Making adjustments to improve performance
Product category sales and unit sales by product line reveal which products drive revenue and which need more focus. This data helps:
- Guide inventory stocking decisions
- Decide which product lines to expand or contract
Customers
Repeat purchase rate indicates how well the store is retaining customers. It shows the percentage of returning customers out of total customers. A higher rate means:
- Customer satisfaction
- Strong brand loyalty
Customer acquisition cost reveals the expense of gaining a new customer. Closely monitoring this KPI helps keep marketing budgets in check. Try using the below formula:
Customer conversion ratio = No of transactions / Customer traffic x 100
Operations
Inventory turns measure how many times inventory is sold and replaced over a period. Higher inventory turns mean:
- Less capital tied up in unsold goods
- Faster inventory velocity
- Potential for lower markdowns
Employee productivity indicators like sales per employee or labor cost as a % of sales help determine staffing needs and compensation models. Optimizing these ratios and implying them on your accounting software for your small businesses can boost efficiency and profitability.
What is a Financial KPI?
A financial key performance indicator, or KPI, is quantifiable metric companies use to measure their growth and success in specific areas of financial performance. Financial KPIs help businesses evaluate whether they are achieving their financial goals, allowing them to gauge the health of the business and make more strategic decisions.
Types of Financial KPIs
There are many examples of financial KPIs companies commonly use:
- Revenue – A business’s total sales over a period, often measured monthly or quarterly. Revenue is important for a company to generate income and meet sales targets.
- Profit margin – Calculated by dividing profits by revenue, this measures the percentage of revenue that remains as profit. A higher profit margin indicates the business is pricing its products appropriately.
- Return on investment (ROI) – Measures the amount of profit generated relative to the cost of investment. Helps businesses determine if an investment was worthwhile.
- Operating expenses – All costs incurred to run normal business operations, like salaries, rent, and cost of goods sold. Tracking changes in operating expenses helps companies identify areas for cost reductions.
- Cash flow – The amount of cash coming in and going out of the business. Positive cash flow means a business can pay its debts and expand; negative cash flow is unsustainable.
For retail businesses in particular:
- Inventory turnover – Measures how efficiently inventory is selling. Calculated by dividing the cost of goods sold by the average inventory. A higher number indicates less leftover inventory.
- Sales per square foot – Calculates revenue generated from each square foot of retail selling space. Indicates retail space productivity and potential for improving sales.
- Customer retention rate – Measures the percentage of customers who continue purchasing over a period. High retention rates show customers are satisfied with the retail experience.
Also Read: Guide to Starting a Retail Business
Benefits of Using KPIs
Financial KPIs provide several important benefits for businesses:
- Align team goals – KPIs allow a business to communicate its financial priorities to employees so everyone works toward the same targets.
- Identify issues early – Tracking financial metrics regularly helps businesses spot problems as soon as they arise, allowing for proactive solutions.
- Benchmark performance – By comparing KPIs to competitors, benchmarks, and past performance, businesses can gauge whether they are performing above or below average.
- Improve efficiency – Analyzing KPI trends over time reveals opportunities for cost reductions, product mix optimization, and process improvements.
- Justify strategic actions – Data from KPIs can be used to justify new strategies, investments, pricing changes, and other decisions to stakeholders.
Why Are Financial Metrics and KPIs Important to Your Business?

Financial performance metrics and key performance indicators (KPIs) provide crucial insights into how well your business is performing. They help you identify your strengths and weaknesses, areas for improvement, and potential threats. Without financial metrics, you would lack an objective view of your business performance.
Here are the main reasons why:
They Help You Track Progress Over Time
Financial metrics give you a snapshot of performance at a point in time, but when you track them regularly over months and years, they help you:
- See trends: Are sales going up or down overall? Is the profit margin increasing or decreasing?
- Identify changes early: Notice when key metrics like inventory turns start to worsen so you can act quickly.
- Measure the impact of changes: Determine if the changes you made actually improved performance.
Without metrics and KPIs, you wouldn’t have a reliable way to tell if your strategies and initiatives are working.
They Highlight Opportunities and Problems
Financial metrics can reveal strengths and weaknesses in your business that you might not otherwise see. For example:
- A low gross margin could mean pricing is too low or your product mix is not optimized.
- High inventory turnover could point to stockouts and losing sales.
- Negative cash flow could signal the need to revamp buying or payment processes.
Once uncovered, you can work on initiatives to improve those areas and boost performance.
They Help Validate Strategic Decisions
Financial metrics can show you how potential changes might impact your business before implementing them. You can:
- Model “what if” scenarios to determine how price increases, promotions, or new products might affect sales and margins.
- Set financial targets for new strategies to help determine success.
- Evaluate expansion plans by analyzing the impact on financials like revenue, costs, and debt capacity.
Financial metrics help you make more informed, data-backed strategic decisions for your business.
They Inform Operational Improvements
Once weaknesses or opportunities are revealed through financial reporting metrics, operational KPIs can pinpoint where to improve within departments:
- Inventory KPIs can indicate excess stock or out-of-stock to manage more efficiently
- Conversion rate can show where to optimize the customer experience
- Employee productivity metrics can highlight ways to increase staff efficiency
Also Read: Most Profitable Retail Business Ideas

Financial metrics to measure retail business performance
There are a number of key financial metrics for small businesses you can analyze to evaluate the performance of your store. These metrics can help you identify areas of strength and weakness so you can improve profitability and growth over time.
Revenue– Revenue, or sales, is the most basic financial metric. How much money is coming into your business from customers? This tells you how well your products and services are selling. You should track total revenue, revenue per product line, and revenue per store, if applicable. Look for consistent revenue growth from month to month and year to year.
Use the formula below to know your average sale, also called average order value:
Average sales order value = Total sales value / Number of transactions
Cost of goods sold- The cost of goods sold (COGS) is the cost you incur to produce the goods you sell. It includes the direct costs attributable to the production of the goods. COGS as a percentage of revenue indicates your margin on the goods after direct costs. You want this percentage to remain consistent or decrease over time as you achieve economies of scale or negotiate better deals with suppliers.
Gross profit- Your gross profit is calculated by subtracting your COGS from your revenue. The gross profit margin indicates the percentage of revenue that remains after COGS to cover operational expenses and generate a profit. A healthy gross profit margin for most retailers ranges from 30% to 50%. To calculate gross profit use:
Gross profit = Revenue per item – Cost of items and selling process
Operating expenses-Your Operational expenses include fixed costs like rent, salaries, utilities, and marketing. Analyze these expenses as a percentage of revenue to identify areas of inefficiency. Look for opportunities to reduce expenses as a percentage of revenue while maintaining or growing your total revenue.
Net profit– Your net profit is what remains after covering all expenses. The net profit margin indicates your profitability. For a stable, profitable retail business, you generally want a net profit margin above 5%. Growth in net profit year over year is a strong indicator of business success.
That covers the key financial performance metrics any retail business should be tracking to evaluate its health and growth. Now comes the fun part – using that data to improve! And one key tool to help you do that is an effective point of sale (POS) system.
Hana Retail is an all-in-one retail POS system that can help you optimize financial performance by providing real-time sales data and insights. This level of visibility into your numbers can help you spot problems or opportunities early, make quick adjustments to pricing or promotions, and improve planning and forecasting. Sign up for FREE today!


